

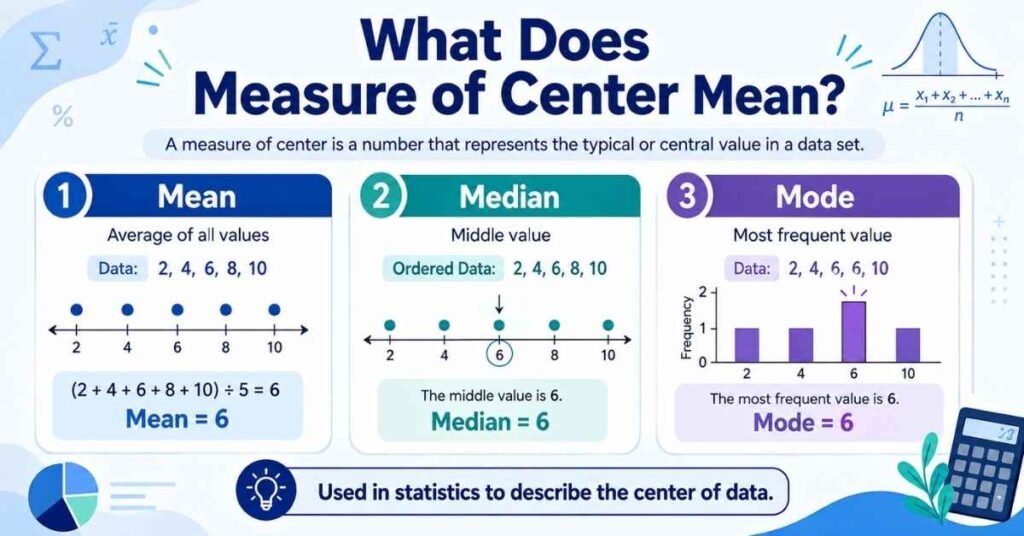
What does measure of center mean? A measure of center is a single number used to describe the typical, middle, or central value of a data set. The most common measures of center are the mean and median, while the mode is also commonly taught as a measure of central tendency. Which measure works best depends on the distribution, outliers, shape of the data, and the question you are trying to answer.
If the phrase “measure of center” sounds confusing because a data set can have more than one center, that is exactly the idea to understand. The mean, median, and mode define “typical” in different ways, so they do not always give the same answer.
Measure of Center Meaning in Simple Words
A measure of center in math is a number that summarizes where the values in a data set are generally located.
Consider this data:
2, 4, 6, 8, 10
Most of the numbers are positioned around 6, so 6 gives us a reasonable idea of the center.
However, statistics offers more than one way to describe that center.
The three familiar measures are:
- Mean: the arithmetic average
- Median: the middle value
- Mode: the most frequently occurring value
The important point is that center does not always mean the literal middle number. It means a numerical value that helps represent what is typical about the distribution.
Why Is It Called a Measure of Center?
The phrase has two parts.
Measure means a numerical summary.
Center refers to the general location where the values in a data set are concentrated or represented.
So, a measure of center answers a question such as:
“What single number could reasonably represent this group of values?”
That number might be the mean, median, or mode depending on the situation.
A measure of center is therefore a summary statistic. It reduces many data values to one number that helps you understand the distribution quickly.
Why Can a Data Set Have More Than One Center?
This is one of the most important ideas in statistics.
Look at this data set:
2, 3, 3, 4, 18
Its measures of center are:
- Mean = 6
- Median = 3
- Mode = 3
Why are the answers different?
Because each measure defines “center” differently.
Mean Uses Every Value
The mean considers the size of all observations.
The large value 18 pulls the mean upward.
Median Uses Position
The median depends on which value lies in the middle after the numbers are ordered.
The middle value is 3.
Mode Uses Frequency
The mode asks which value appears most often.
Since 3 appears twice, it is the mode.
This is why statistics does not always have a single perfect center. Different measures answer different questions about what is typical.
Mean: The Arithmetic Average
The mean is probably the most familiar measure of center.
To find it:
- Add all the values.
- Divide by the number of values.
Mean Formula
Mean = Sum of all values ÷ Number of values
Suppose the data are:
4, 6, 8
Add them:
4 + 6 + 8 = 18
There are three values:
18 ÷ 3 = 6
So the mean is 6.
What Does the Mean Really Tell You?
The mean can be thought of as a fair-share value.
Imagine redistributing the total equally among all observations. If every value became the same while the total stayed unchanged, each one would equal the mean.
The mean is also sometimes described as a balance point of a distribution.
When Is the Mean Useful?
The mean usually works well when:
- the data are numerical
- the distribution is reasonably symmetric
- there are no strong outliers
- every observation should influence the result
The weakness of the mean is that extreme values can change it significantly.
Median: The Middle Value
The median is the middle value when data are arranged from smallest to largest.
Consider:
3, 5, 8
The middle value is 5.
So:
Median = 5
Median With an Even Number of Values
Suppose the data are:
2, 4, 6, 10
There are two middle values:
4 and 6
Find their mean:
(4 + 6) ÷ 2 = 5
So the median is 5.
Why Is the Median Important?
Unlike the mean, the median depends mainly on position, not the size of every value.
That makes the median more resistant to outliers.
It is particularly useful for data such as:
- household income
- salaries
- home prices
- waiting times
- other skewed distributions
Mode: The Most Frequent Value
The mode is the value that occurs most often.
Example:
2, 3, 3, 5, 7
The number 3 appears more often than any other value.
So:
Mode = 3
Can a Data Set Have More Than One Mode?
Yes.
A data set can have:
- one mode
- two modes, called bimodal
- multiple modes
- no mode if no value repeats
Example:
2, 2, 5, 5, 8
The modes are:
2 and 5
Is Mode Really a Measure of Center?
The mode is widely taught as a measure of central tendency, but it is a little different from mean and median.
It does not necessarily sit near the visual middle of numerical data.
Its strength is answering:
“What value occurs most often?”
This makes mode useful for:
- shoe sizes
- clothing sizes
- favorite colors
- product preferences
- most common scores
- categorical data
Mean vs. Median vs. Mode
Here is a simple comparison:
| Measure | What It Uses | Best For | Main Limitation |
|---|---|---|---|
| Mean | Every value | Symmetric numerical data | Sensitive to outliers |
| Median | Middle position | Skewed data and outliers | Does not use exact magnitude of every value |
| Mode | Frequency | Most common value or category | May have multiple values or no mode |
The best measure of center depends on what your data look like and what question you need to answer.
How Do Outliers Affect Measures of Center?
An outlier is an unusually high or low value compared with the rest of the data.
Consider:
2, 3, 3, 4, 5
Mean:
(2 + 3 + 3 + 4 + 5) ÷ 5 = 3.4
Median:
3
Now replace 5 with 50:
2, 3, 3, 4, 50
Mean:
(2 + 3 + 3 + 4 + 50) ÷ 5 = 12.4
Median:
3
The mean jumped from 3.4 to 12.4.
The median stayed at 3.
Why?
The mean includes the magnitude of every value, so 50 dramatically increases the total.
The median cares mainly about position, so the extreme value has much less influence.
What Does “Resistant” Mean in Statistics?
A resistant statistic does not change very much when extreme values are introduced.
The median is resistant to outliers compared with the mean.
For example, increasing the largest value from 50 to 500 could dramatically increase the mean, while the median might remain exactly the same.
This does not mean the median is always better.
It means the median is often useful when extreme observations would make the mean a poor representation of a typical value.
Which Measure of Center Should You Use?
There is no universal answer.
Use the data distribution and context.
Use the Mean When
The mean is often appropriate when:
- data are quantitative
- the distribution is roughly symmetric
- strong outliers are absent
- you want every value to influence the result
Use the Median When
The median is often useful when:
- data are skewed
- extreme outliers exist
- you want the middle position
- the mean would be pulled away from typical values
Use the Mode When
Mode makes sense when:
- you need the most frequently occurring value
- frequencies matter
- data may be categorical
- you want to know the most common choice
The CENTER Method for Choosing a Measure
Use this simple framework when deciding which measure of center fits your data.
C — Check the Distribution
Is the data roughly symmetric or skewed?
E — Examine Extreme Values
Look for unusually large or small outliers.
N — Name the Question
Are you trying to find:
- a fair-share average?
- the middle observation?
- the most common value?
T — Test Mean and Median
Calculate both.
If they are far apart, skewness or extreme values may be influencing the mean.
E — Evaluate Spread
Look at how widely the data vary.
R — Report the Result in Context
Do not simply say:
Median = 52
Say:
The median household income is $52,000, meaning half of the observations fall below it and half above it.
Interpretation matters as much as calculation.
Symmetric vs. Skewed Data
The shape of a distribution affects which measure of center may be most representative.
Symmetric Distribution
In a roughly symmetric distribution, values are balanced on both sides of the center.
Example:
6, 8, 10, 12, 14
Mean = 10
Median = 10
When there are no strong outliers, the mean often describes the center well.
Right-Skewed Distribution
A right-skewed distribution has a long tail toward larger values.
Typical examples include:
- household income
- home prices
- wealth
Large observations often pull the mean above the median.
Left-Skewed Distribution
A left-skewed distribution has a longer tail toward smaller values.
In that situation, low extreme values can pull the mean below the median.
The useful relationship is:
distribution shape → choice of measure of center
Is Average the Same as Measure of Center?
Not exactly.
In everyday language, average usually means the arithmetic mean.
For example:
“The average test score was 82.”
usually means:
Mean = 82
But statistics has several ways of describing what is typical.
The median may represent the center better when data are skewed, while the mode may be useful when the most common value matters.
For clarity, use the word mean when you specifically mean the arithmetic calculation.
Measure of Center vs. Measure of Variation
A measure of center and a measure of variation describe different characteristics of data.
Measure of Center
Tells you where the distribution is generally located.
Examples include:
- mean
- median
Measure of Variation
Tells you how spread out the observations are.
Examples include:
- range
- interquartile range (IQR)
- mean absolute deviation (MAD)
- standard deviation
Both are important.
Knowing the center without knowing the spread can give an incomplete picture.
Same Center, Different Spread
Consider two datasets.
Dataset A
8, 9, 10, 11, 12
Mean = 10
Dataset B
0, 5, 10, 15, 20
Mean = 10
Both datasets have exactly the same mean.
But they clearly do not look the same.
Dataset A is tightly clustered around 10.
Dataset B is spread much farther apart.
The key lesson is:
Same center does not mean same distribution.
This is why statistics often describes data using center, spread, and shape together.
Measures of Center on Graphs
Measures of center can also help interpret visual data displays.
Dot Plot
A dot plot shows individual observations.
Look at:
- where the dots cluster
- whether outliers appear
- whether the distribution looks symmetric or skewed
You can then decide whether mean or median is a better summary.
Histogram
A histogram groups numerical values into intervals.
The shape can help identify:
- symmetry
- skewness
- unusual tails
That information matters when selecting a measure of center.
Box Plot
A box plot directly displays the median as a line inside the box.
The box also helps show spread through the quartiles and IQR.
The mean is not automatically displayed unless it is separately marked.
Real-Life Examples of Choosing a Measure of Center
Salary Example
Suppose nine employees earn around $50,000, while one CEO earns $4 million.
The CEO’s salary would pull the mean upward.
The median salary would usually give a better picture of what a typical employee earns.
Test Score Example
Suppose exam scores are evenly distributed around 82 with no unusual extreme values.
The mean can provide a useful summary.
Shoe Size Example
A shoe store wants to know which size customers purchase most often.
The most useful measure is the mode.
Home Price Example
A neighborhood contains mostly $300,000 homes but several multimillion-dollar properties.
The median home price may represent the typical house better than the mean.
Common Mistakes With Measures of Center
Mistake 1: Thinking Center Always Means Median
The median is the literal middle position, but the mean is also a measure of center.
Mistake 2: Forgetting to Order the Data
You must arrange the values from least to greatest before finding the median.
Mistake 3: Dividing Mean by the Wrong Number
The mean is divided by the number of observations, not by the largest value.
Mistake 4: Assuming Every Dataset Has a Mode
A set such as:
2, 4, 6, 8
has no mode because no value occurs more frequently.
Mistake 5: Ignoring Outliers
An outlier can make the mean look unrepresentative.
Mistake 6: Choosing a Statistic Without Looking at the Distribution
Always consider:
- shape
- skew
- outliers
- context
Mistake 7: Describing a Dataset Using Center Alone
Two datasets can have the same center while having completely different variability.
Worked Example: Find All Measures of Center
Consider:
4, 5, 5, 6, 20
Step 1: Find the Mean
Add the values:
4 + 5 + 5 + 6 + 20 = 40
Divide by five:
40 ÷ 5 = 8
Mean = 8
Step 2: Find the Median
The values are already ordered:
4, 5, 5, 6, 20
The middle number is:
5
Median = 5
Step 3: Find the Mode
The value appearing most often is:
5
Mode = 5
Step 4: Interpret the Results
The mean is 8, but most observations are much closer to 5.
The value 20 pulls the mean upward.
In this dataset, the median of 5 may better describe a typical observation.
This is more meaningful than simply calculating all three numbers and stopping.
Why Mean and Median Tell Different Stories
The difference comes from how they are calculated.
Mean Responds to Magnitude
Every value contributes to the total.
Large numbers therefore exert more influence.
Median Responds to Position
The median looks at the middle location after ordering the values.
An extreme number can become much larger without changing its position.
That is why mean and median represent different mathematical ideas of center.
Should You Remove an Outlier?
Not automatically.
An outlier could represent:
- a data-entry error
- a measurement mistake
- a genuine rare case
- a different population
- an important observation
A better process is:
- Investigate the value.
- Check whether it is correct.
- Decide whether it belongs in the analysis.
- Explain your decision.
Removing an unusual value simply because it changes the mean can lead to misleading conclusions.
Why Measures of Center Matter
Measures of center help summarize large collections of data quickly.
They allow people to:
- compare groups
- communicate typical values
- identify patterns
- make decisions
- describe distributions
You encounter these statistics in everyday contexts such as:
- average exam scores
- median household income
- median home prices
- average temperatures
- sports performance
- waiting times
- business data
The important question is not simply “What is the center?”
It is:
“Which measure gives the most useful description of this data in this context?”
LEARN MORE: Literal and Nonliteral Meaning
What Grade Do Students Learn Measures of Center?
In many U.S. curricula, measures of center become a major statistics topic around Grade 6.
Students typically learn to:
- recognize statistical distributions
- calculate mean and median
- interpret center
- examine variability
- describe shape
- consider the effect of outliers
Later grades expand those ideas to:
- IQR
- standard deviation
- population comparisons
- sampling
- more advanced distributions
Exact pacing varies by state, district, school, and curriculum.
Practice: Find the Measure of Center
Try these questions before checking the answers.
Question 1
Find the mean of:
4, 6, 8
Question 2
Find the median of:
2, 5, 9
Question 3
Find the mode of:
3, 3, 4, 7
Question 4
Find the mean and median of:
2, 3, 4, 5, 20
Which one better represents a typical value?
Answers
1. Mean = 6
2. Median = 5
3. Mode = 3
For Question 4:
Mean:
(2 + 3 + 4 + 5 + 20) ÷ 5 = 6.8
Median:
4
The high value 20 pulls the mean upward, so the median may better represent a typical observation.
Frequently Asked Questions About Measures of Center
What does measure of center mean in simple words?
A measure of center is one number used to represent the typical or central location of a data set.
What are the common measures of center?
The most common are mean and median, while mode is also commonly taught as a measure of central tendency.
Why is it called a measure of center?
It summarizes where the values in a distribution are generally located or what value can reasonably represent them.
Is the mean a measure of center?
Yes. The mean is a measure of center calculated by adding all data values and dividing by the number of observations.
Is the median always the center?
The median is the middle position in ordered data, but it is not the only statistical way to describe center.
Is mode a measure of center?
Mode is commonly treated as a measure of central tendency. It tells you which value occurs most frequently.
Which measure of center is best?
There is no single best measure. The right choice depends on distribution shape, outliers, data type, and the question being asked.
Which measure of center is best when there is an outlier?
The median is often more representative because it is less affected by extreme values.
Why do outliers affect the mean?
The mean uses every numerical value. An extreme observation changes the total and therefore changes the final mean.
What does resistant mean in statistics?
A resistant statistic changes relatively little when extreme values are added or modified.
What is the difference between center and spread?
Center describes where the data are located, while spread describes how much the values vary.
What measure of center is good for skewed data?
The median is often useful for strongly skewed data, particularly when extreme values would make the mean misleading.
What measure of center works well for symmetric data?
The mean often works well for approximately symmetric numerical distributions without strong outliers.
Can two datasets have the same center?
Yes. Two datasets can have the same mean or median while having very different spread, shape, and individual values.
Final Thoughts: What Does Measure of Center Mean?
What does measure of center mean ultimately comes down to one idea: a measure of center is a single numerical summary that helps describe what is typical about a dataset.
The three familiar approaches answer different questions:
- Mean uses all numerical values.
- Median uses the middle position.
- Mode uses frequency.
The best choice depends on outliers, skewness, distribution shape, variability, and context.
Most importantly, remember that statistics is not simply about calculating a number. A useful measure of center should help you understand and communicate what the data actually say.

1 thought on “What Does Measure of Center Mean? Definition & Examples”