

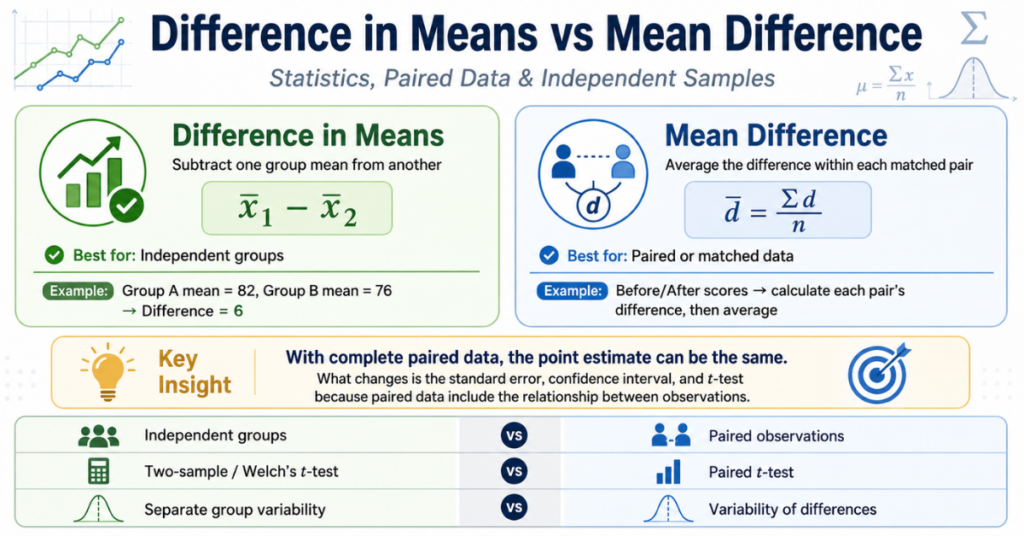
Difference in means vs mean difference can sound like two completely different statistical ideas, but the distinction is more subtle. A difference in means usually means subtracting the average of one group from the average of another, while a mean difference in paired-data analysis often means calculating each matched pair’s difference first and then averaging those differences. With the same complete paired observations, both calculations produce the same numerical point estimate. What changes is the way variability, standard error, confidence intervals, and statistical significance are calculated because paired and independent data have different structures.
That is why students often calculate both and think something has gone wrong when the answers match. Usually, nothing is wrong. The confusing part is the terminology and the statistical inference, not the arithmetic.
Difference in Means vs Mean Difference: Quick Comparison
The easiest way to separate the ideas is to look at how the data are organized.
| Feature | Difference in Means | Mean Difference in Paired Data |
|---|---|---|
| Basic meaning | Subtract one group mean from another | Average the differences within matched pairs |
| Formula | (\bar X_1-\bar X_2) | (\bar d=\frac{\sum d_i}{n}) |
| Typical data | Independent samples | Paired or dependent samples |
| Common examples | Treatment vs control | Before vs after |
| Point estimate | Difference between averages | Average paired change |
| Can both give the same number? | Yes | Yes |
| Typical test | Welch’s or two-sample t-test | Paired t-test |
| Variation comes from | Both groups separately | Pairwise differences |
| Does pairing matter? | No meaningful pairing assumed | Yes |
| Main risk | Ignoring dependence | Creating artificial pairs |
A useful rule is simple:
If every observation in one sample has a meaningful partner in the other sample, your data may be paired. If observations belong to two unrelated groups, they are usually independent.
What Does Difference in Means Mean?
The difference in means is the difference between the averages of two groups.
Its basic formula is:
[ \bar X_1-\bar X_2 ]
where:
- (\bar X_1) = mean of the first sample
- (\bar X_2) = mean of the second sample
Suppose two independent groups of students take the same test.
- Group A mean score = 82
- Group B mean score = 76
The difference in means is:
[ 82-76=6 ]
So Group A scored an average of 6 points higher than Group B.
This value is also called a difference between means, difference of means, mean difference between groups, or sometimes simply a mean difference.
That last point matters because statistical terminology is not perfectly standardized.
Why Subtraction Order Matters
A mean difference is normally a signed difference, not automatically an absolute value.
If:
[ A-B=6 ]
then:
[ B-A=-6 ]
The magnitude is the same, but the interpretation changes.
For example:
- Treatment − Control = −5 mmHg
- Control − Treatment = +5 mmHg
Both describe the same separation, but the sign tells you which group is higher.
Always state the direction of subtraction when reporting a difference between group means.
What Does Mean Difference Mean?
The phrase mean difference has more than one legitimate statistical use.
In many research papers and statistical references, mean difference simply means:
[ \bar X_1-\bar X_2 ]
In other words, it is another name for the difference in means.
However, in lessons about paired samples, instructors often use mean difference to describe the average of individual pairwise differences.
Suppose every observation has a meaningful match. Define:
[ d_i=X_i-Y_i ]
Then calculate:
[ \bar d=\frac{\sum d_i}{n} ]
Here, (\bar d) represents the mean of the paired differences.
So when someone asks whether mean difference and difference in means are the same, the correct answer depends on context.
Mean Difference in Paired Data
Paired data occur when observations have a natural one-to-one relationship.
Common examples include:
- before and after measurements on the same person
- blood pressure before and after treatment
- test scores before and after a course
- left-eye and right-eye measurements
- twins or matched participants
- the same machine tested under two conditions
- repeated measurements on the same experimental unit
Instead of treating the two columns as unrelated samples, you calculate a difference score for each pair.
For example:
| Person | Before | After | Difference |
|---|---|---|---|
| 1 | 72 | 68 | 4 |
| 2 | 80 | 75 | 5 |
| 3 | 76 | 73 | 3 |
| 4 | 84 | 78 | 6 |
The individual differences are:
[ 4,\ 5,\ 3,\ 6 ]
Their mean is:
[ \bar d=\frac{4+5+3+6}{4} ]
[ \bar d=4.5 ]
So the mean paired difference is 4.5 points.
Why Mean of Differences Equals Difference of Means
This is the part that surprises many students.
Using the same dataset:
Calculate the Before Mean
[ \frac{72+80+76+84}{4}=78 ]
Calculate the After Mean
[ \frac{68+75+73+78}{4}=73.5 ]
Now subtract:
[ 78-73.5=4.5 ]
The difference in means is 4.5.
Earlier, the mean of the individual paired differences was also:
[ 4.5 ]
So:
[ \bar X-\bar Y=\bar d ]
This is not a coincidence.
The Algebra Behind the Equality
For complete paired observations:
[
\bar d
\frac{(X_1-Y_1)+(X_2-Y_2)+…+(X_n-Y_n)}{n} ]
Rearrange the terms:
[
\bar d
\frac{\sum X_i}{n}
\frac{\sum Y_i}{n} ]
Therefore:
[ \bar d=\bar X-\bar Y ]
This property follows from the linearity of the arithmetic mean.
In plain English:
Averaging the differences gives the same point estimate as subtracting the two averages, provided both calculations use the same complete paired observations.
If the Number Is the Same, Why Does Pairing Matter?
This is the most important concept in the entire comparison.
The point estimate may be identical, but statistical inference can be very different.
The mean difference tells you:
How far apart are the averages?
Inferential statistics asks:
How precisely have we estimated that difference?
That second question depends on:
- variance
- standard deviation
- standard error
- covariance
- correlation
- sample size
- confidence interval
- degrees of freedom
- test statistic
- p-value
Paired and independent analyses handle those quantities differently.
Pairing Changes the Variability
For paired observations:
[
Var(X-Y)
Var(X)+Var(Y)-2Cov(X,Y) ]
The important term is:
[ Cov(X,Y) ]
or the relationship between paired measurements.
If before and after values from the same person are strongly positively related, the covariance may reduce the variance of the difference scores.
That can produce a smaller standard error and a more precise estimate.
This is why a paired study can often detect changes more efficiently than treating the same observations as unrelated.
A Practical Example of Why Pairing Helps
Imagine measuring blood pressure before and after treatment.
One patient naturally has blood pressure around 155 mmHg. Another is usually around 120 mmHg.
Those patients differ substantially from one another.
But in a paired analysis, you ask:
How much did each individual change?
Patient A:
[ 155\rightarrow145 ]
Difference:
[ 10 ]
Patient B:
[ 120\rightarrow110 ]
Difference:
[ 10 ]
The patients have very different baseline values, yet both changed by exactly 10 mmHg.
Pairing helps remove some between-person variability because each person effectively serves as their own comparison.
Same Mean Difference Does Not Mean Same Statistical Result
Suppose the observed mean difference is:
[ 4.5 ]
Whether you calculate it from group means or paired differences, that point estimate may stay the same.
But the standard error can change substantially.
A paired analysis bases uncertainty on the variability of:
[ d_1,d_2,…,d_n ]
An independent analysis bases uncertainty on the separate variability of the two groups.
Therefore two analyses can have:
- the same mean difference
- different standard errors
- different confidence intervals
- different t-statistics
- different degrees of freedom
- different p-values
This leads to one of the most useful rules in statistics:
Same estimate does not mean same uncertainty.
Paired vs Independent Samples
Understanding the data structure is more important than memorizing terminology.
Independent Samples
Two samples are independent when observations in one group have no meaningful one-to-one relationship with observations in the other.
Examples include:
- patients randomly assigned to two different treatment groups
- students from two unrelated schools
- customers from two independent markets
- separate treatment and control groups
- two randomly selected populations
If one person disappears from Group A, there is no specific person in Group B whose observation must also disappear.
Paired Samples
Observations are paired when every observation has a meaningful counterpart.
Examples include:
- the same person measured twice
- before and after treatment
- matched case-control participants
- two measurements from the same body
- repeated measurements on the same machine
- twins deliberately matched in a study
The individual pairing carries statistical information.
Two Columns Do Not Automatically Mean Paired Data
This mistake is extremely common.
Suppose you have:
| Group A | Group B |
|---|---|
| 10 | 15 |
| 12 | 13 |
| 14 | 17 |
Simply placing the values in adjacent rows does not make them paired.
There must be a meaningful reason why:
- 10 belongs with 15
- 12 belongs with 13
- 14 belongs with 17
Pairing is determined by how the data were collected, not by spreadsheet layout.
Which Statistical Test Should You Use?
The correct procedure depends mainly on whether observations are dependent or independent.
Use a Paired t-Test When
A paired t-test is typically appropriate when:
- the same subjects are measured twice
- participants are deliberately matched
- observations have a meaningful one-to-one relationship
- the outcome is continuous
- the goal is to test whether the population mean difference equals a specified value, commonly zero
Use an Independent Two-Sample Test When
Use an independent test when:
- two groups contain unrelated observations
- no natural matching exists
- participants belong to separate populations or conditions
- one observation does not identify a partner in the other group
For many independent-sample situations, Welch’s t-test is preferred because it does not require the two population variances to be equal.
A Quick Decision Framework
Ask these questions in order.
1. Does each observation have one meaningful partner?
If no, the samples are likely independent.
If yes, continue.
2. Is the relationship genuine?
Examples include:
- same person
- same experimental unit
- matched participant
- repeated measurement
If yes, a paired analysis may be appropriate.
3. Are the pairs complete?
If some observations are missing, you need to consider how incomplete pairs are handled before calculating the paired mean difference.
4. What question are you testing?
Are you comparing:
- two independent population means, or
- the population mean of paired differences?
That determines the inferential procedure.
What Does a Paired t-Test Actually Test?
A paired t-test turns two measurements into one difference variable.
For every matched pair:
[ d_i=X_i-Y_i ]
Then you analyze:
[ d_1,d_2,…,d_n ]
The null hypothesis is commonly:
[ H_0:\mu_d=0 ]
where:
[ \mu_d ]
is the population mean paired difference.
The paired t-test therefore behaves like a one-sample t-test applied to the difference scores.
Standard Error for a Paired Mean Difference
The standard error is:
[ SE_{\bar d}=\frac{s_d}{\sqrt n} ]
where:
- (s_d) = standard deviation of the pairwise differences
- (n) = number of complete pairs
The test statistic is:
[ t= \frac{\bar d-\mu{d0}} {SE{\bar d}} ]
If the hypothesized mean difference is zero:
[ t= \frac{\bar d} {s_d/\sqrt n} ]
The crucial feature is that the calculation uses the variation among the differences, not the two group standard deviations separately.
Difference in Means for Independent Groups
For two independent populations, the parameter of interest is usually:
[ \mu_1-\mu_2 ]
The sample estimate is:
[ \bar X_1-\bar X_2 ]
For Welch’s approach, the standard error is:
[ SE= \sqrt{ \frac{s_1^2}{n_1} + \frac{s_2^2}{n_2} } ]
Here:
- (s_1^2) = variance of sample 1
- (s_2^2) = variance of sample 2
- (n_1) = first sample size
- (n_2) = second sample size
Unlike paired analysis, there is no covariance term because the observations are treated as independent.
Confidence Intervals Make the Difference Easier to See
A confidence interval does more than report the observed mean difference. It describes the uncertainty surrounding the estimated population difference.
For example:
Mean difference = 4.5 points
with a 95% confidence interval of:
[ [2.1,\ 6.9] ]
is more informative than reporting 4.5 alone.
The point estimate tells you the best estimate from the sample.
The confidence interval tells you which population differences remain reasonably compatible with the data under the model.
What If the Confidence Interval Includes Zero?
Suppose the confidence interval is:
[ [-1.2,\ 6.3] ]
Zero lies inside the interval.
At the corresponding significance level, the data do not provide enough evidence to rule out a zero population mean difference.
That does not prove the groups are identical.
It means the observed data remain compatible with a range of effects that includes zero.
Why Comparing Two Separate Confidence Intervals Can Mislead You
Another common mistake is looking at the confidence interval around each group mean and asking whether those intervals overlap.
That is not the same as calculating a confidence interval for the difference between means.
If the research question concerns:
[ \mu_1-\mu_2 ]
the most relevant interval is usually the interval for that difference itself.
This calculation directly incorporates the appropriate uncertainty structure.
Mean Difference vs Standardized Mean Difference
The mean difference (MD) and standardized mean difference (SMD) are related but not interchangeable.
Mean Difference
A raw mean difference keeps the original measurement units.
Examples:
- 5 mmHg
- $12
- 4 test points
- 2.3 kilograms
This makes the result easy to interpret when all groups use the same measurement scale.
Standardized Mean Difference
The standardized mean difference expresses the effect in units of standard deviation.
A simplified form is:
[ SMD= \frac{\text{difference between means}} {\text{standard deviation}} ]
This is useful when researchers measure the same general concept with different instruments or scales.
For example, two studies might measure depression with different questionnaires. Their raw scores are not directly comparable, so a standardized effect may be more useful.
Mean Difference vs Cohen’s d
Mean difference is not the same as Cohen’s d.
Suppose:
- Treatment mean = 80
- Control mean = 70
The raw difference is:
[ 80-70=10 ]
So the mean difference is 10 points.
If the relevant standard deviation is 20:
[ d=\frac{10}{20}=0.5 ]
Now the standardized difference is approximately 0.5 standard deviations.
The two statistics answer related but different questions:
- Mean difference: How many original units apart are the averages?
- Cohen’s d: How large is that difference relative to the variation in the data?
Statistical Significance vs Practical Significance
A statistically significant mean difference does not automatically mean an important difference.
Suppose a study with 100,000 participants detects:
[ 0.2 ]
points of difference between two groups.
The p-value may be extremely small because the sample is huge.
But ask the more important practical question:
Does a 0.2-point difference matter?
Statistical significance focuses on evidence against a null hypothesis.
Practical significance focuses on whether the magnitude matters in the real world.
Whenever possible, interpret:
- mean difference
- confidence interval
- measurement units
- effect size
- domain importance
together.
What Does a Negative Mean Difference Mean?
A negative mean difference simply reflects the direction of subtraction.
Suppose:
[ Treatment-Control=-7 ]
That means the treatment-group average is 7 units lower than the control-group average.
Whether that is beneficial or harmful depends on the outcome.
For blood pressure:
lower may be better.
For an exam score:
lower may be worse.
Never interpret a negative mean difference without checking:
- which group was subtracted from which
- what the outcome represents
- whether larger or smaller values are desirable
When Mean of Differences and Difference of Means May Not Match
The identity:
[ \bar d=\bar X-\bar Y ]
works cleanly when both calculations use the same complete observations and compatible weighting.
Real datasets can be messier.
Missing Paired Observations
Suppose you collect:
- baseline measurements from 100 people
- follow-up measurements from only 90 people
If the baseline mean uses all 100 observations but the mean paired difference uses only the 90 complete pairs, you are no longer averaging exactly the same data.
The two results may therefore differ.
Different Analysis Samples
The same problem occurs if:
- one calculation excludes outliers
- another includes them
- different missing-value rules are used
- filtering changes the observations entering each calculation
Always verify that the statistics are based on the same analysis sample before expecting exact equality.
Unequal Weights
Weighted means can complicate the identity.
If observations receive different weights, the mean of weighted pairwise differences will equal the difference between weighted means only when the weights are applied consistently.
Adjusted Means
Regression, ANCOVA, generalized models, and estimated marginal means can produce adjusted mean differences.
These are not necessarily simple raw differences between arithmetic sample means.
The reported number may incorporate:
- covariate adjustment
- model assumptions
- weighting
- interactions
- baseline adjustment
That is why researchers should check exactly what a statistical package means by estimated mean difference.
A Powerful Demonstration: Shuffle the Pairs
There is a simple way to understand why pairing affects uncertainty rather than the arithmetic difference.
Suppose you have two columns:
[ X=(10,20,30) ]
and:
[ Y=(8,19,27) ]
Their means are:
[ \bar X=20 ]
and:
[ \bar Y=18 ]
So:
[ \bar X-\bar Y=2 ]
Using the original pairs, the differences are:
[ 2,\ 1,\ 3 ]
Their mean is:
[ 2 ]
Now rearrange the second column:
[ Y=(27,8,19) ]
The group mean of (Y) is still 18.
The difference between the group means is therefore still:
[ 2 ]
But the new pairwise differences become:
[ -17,\ 12,\ 11 ]
Their average is still:
[ 2 ]
Yet their variability is dramatically larger.
That means:
- same mean difference
- same difference between group averages
- very different standard deviation of paired differences
- potentially very different standard error
- very different paired t-statistic
This demonstrates why pairing contains information about covariance and variability, not simply about the two means.
Why You Should Never Create Random Pairs
If two samples are genuinely independent, you should not arbitrarily match the first observation in one group with the first observation in another.
Doing so does not create legitimate paired data.
A valid pair requires a defensible relationship such as:
- same participant
- same experimental unit
- predetermined matched participant
- twin pair
- repeated measurement
- natural left-right pairing
Random pairing can create a meaningless covariance structure and produce misleading statistical inference.
Common Mistakes When Comparing Means
Treating Terminology as Universal
Some textbooks use mean difference specifically for paired data. Other sources use it for any difference between group means.
Always interpret the phrase from context.
Treating Paired Data as Independent
This discards information about the relationship between paired observations and can make the estimate less precise.
Treating Independent Data as Paired
Arbitrary matching is not legitimate.
Reporting Only a p-Value
A p-value does not tell the reader how large the observed difference is.
Report the estimate and confidence interval as well.
Ignoring the Direction of Subtraction
A result of +5 and −5 describes the same magnitude but opposite directions.
Confusing MD With SMD
A mean difference stays in the original measurement units.
A standardized mean difference expresses the difference relative to variability.
Assuming Equal Means Mean Equal Distributions
Two groups can have the same mean but completely different:
- variances
- shapes
- outliers
- ranges
- distributions
A mean is only one summary statistic.
Ignoring Missing Pairs
Incomplete before-and-after observations can change the analysis sample and complicate simple mean comparisons.
Use the PAIR Framework Before Choosing an Analysis
A simple framework can prevent most mistakes.
P — Pairing
Ask:
Are observations genuinely matched?
Do not decide based on column layout.
A — Average
Calculate the relevant estimate:
- difference between independent means, or
- average paired difference
I — Inference
Choose a procedure that respects the data structure.
That determines:
- standard error
- confidence interval
- degrees of freedom
- test statistic
- p-value
R — Report
State:
- which direction was subtracted
- estimated mean difference
- units
- confidence interval
- statistical procedure
- practical interpretation
The calculation itself is usually the easy part. Correctly identifying the relationship between observations is what prevents analytical errors.
Worked Example: Before-and-After Scores
Suppose four students complete a training program.
| Student | Before | After | Before − After |
|---|---|---|---|
| A | 70 | 74 | -4 |
| B | 76 | 80 | -4 |
| C | 82 | 85 | -3 |
| D | 68 | 74 | -6 |
Mean Before
[ \bar X=\frac{70+76+82+68}{4}=74 ]
Mean After
[ \bar Y=\frac{74+80+85+74}{4}=78.25 ]
Difference in Means
[ 74-78.25=-4.25 ]
Mean of Differences
[
\frac{-4-4-3-6}{4}
-4.25 ]
Both calculations give:
[ -4.25 ]
The negative sign means that before scores were 4.25 points lower than after scores, because the calculation used:
[ Before-After ]
If we had calculated:
[ After-Before ]
the result would be:
[ +4.25 ]
The substantive conclusion would be identical.
Worked Example: Two Independent Groups
Suppose a new teaching method is tested with two unrelated groups.
Group A
- (n=40)
- mean = 86
- SD = 8
Group B
- (n=35)
- mean = 81
- SD = 10
The estimated difference in means is:
[ 86-81=5 ]
The Welch standard error is approximately:
[ SE= \sqrt{ \frac{8^2}{40}+ \frac{10^2}{35} } ]
[ SE= \sqrt{ 1.6+2.857 } ]
[ SE\approx2.11 ]
The point estimate is 5 points, but inference must also consider the standard error, confidence interval, and appropriate degrees of freedom.
Unlike paired data, there is no within-person covariance to preserve.
How to Report a Mean Difference Correctly
A clear independent-groups result might be written as:
Group A scored an average of 5 points higher than Group B (mean difference = 5 points, 95% CI [lower limit, upper limit]).
For paired observations:
Scores increased by an average of 4.25 points after training compared with before training (mean paired difference = 4.25 points, 95% CI [lower limit, upper limit]).
Good reporting usually includes:
- direction
- mean difference
- measurement units
- confidence interval
- statistical procedure
- practical interpretation
Avoid reporting a p-value by itself.
What Statistical Software May Call the Result
Different statistical programs use slightly different labels.
R
Depending on the function, you may see terms such as:
- difference in means
- mean of the differences
- estimate
- confidence interval
SPSS
A paired analysis often includes:
- paired differences
- mean
- standard deviation
- standard error mean
- confidence interval of the difference
Excel
You may need to create a difference column manually for paired analysis depending on the workflow you use.
Minitab
Output may include:
- difference
- SE of difference
- confidence interval
- test statistic
The safest approach is:
Do not rely only on the label beside the result. Check which statistical procedure was run and how the data were structured.
Beginner-to-Expert Explanation
If the terminology still feels confusing, use this progression.
Beginner
Difference in means means one average minus another average.
Intermediate
In paired data, mean difference often means calculating each pair’s difference and then averaging those differences.
Advanced
For the same complete pairs:
[ \bar X-\bar Y=\overline{X-Y} ]
but paired and independent analyses calculate uncertainty differently because paired observations contain information about correlation and covariance.
Research Level
In research literature, mean difference may also describe a raw unstandardized effect measure between independent treatment groups. Model-based analyses may report adjusted mean differences that are not simple arithmetic differences between raw sample means.
The label alone is therefore not enough. Study design and calculation method provide the real meaning.
Frequently Asked Questions
Are Mean Difference and Difference in Means the Same?
Sometimes. Many statistical sources use mean difference and difference in means as synonyms. In paired-data teaching, mean difference often specifically means the average of within-pair differences.
Is Mean of Differences Equal to Difference of Means?
Yes, when both calculations use the same complete paired observations with consistent weighting:
[ \overline{X-Y}=\bar X-\bar Y ]
Missing observations, different analysis samples, weights, or model-based adjustments can break this simple equality.
Why Does a Paired t-Test Give a Different p-Value?
Because a paired t-test calculates uncertainty using the standard deviation of the pairwise differences.
An independent test uses the two group variances separately.
The point estimate may be identical while the standard error differs.
Does a Paired t-Test Compare Two Means?
Conceptually, yes, but computationally a paired t-test usually reduces each pair to a difference score and then tests whether the population mean difference equals zero.
Can a Mean Difference Be Negative?
Yes.
A negative mean difference simply means the group listed first in the subtraction has a lower mean than the second group.
What Does a Mean Difference of Zero Mean?
A sample mean difference of zero means the two observed averages are equal in that comparison.
It does not necessarily prove that the entire distributions or population means are identical.
How Do I Know If My Data Are Paired?
Ask:
Does each observation in one condition have one meaningful counterpart in the other condition?
If yes, the data may be paired.
Is Mean Difference an Effect Size?
A raw mean difference can be used as an unstandardized effect measure, especially when the original measurement units are meaningful.
What Is Mean Difference vs Standardized Mean Difference?
A mean difference stays in original units.
A standardized mean difference divides the difference by a measure of variability and reports the effect in standard-deviation units.
Should I Use a Paired t-Test or Welch’s t-Test?
Use a paired t-test when observations are genuinely dependent or matched.
Use Welch’s two-sample t-test when groups are independent and you want to compare their means without assuming equal population variances.
Does a Larger Mean Difference Always Mean a Stronger Result?
No.
A difference must be interpreted alongside:
- sample size
- variability
- standard error
- confidence interval
- effect size
- practical importance
A larger point estimate with enormous uncertainty may provide weaker evidence than a smaller but precisely estimated difference.
Final Takeaway
The most important lesson in difference in means vs mean difference is that the terminology can make the concepts look more different than they really are. Difference in means usually refers to subtracting two group averages, while mean difference in paired analysis often refers to averaging the differences within matched observations. When the same complete pairs are used, both calculations produce the same point estimate.
What truly changes is the statistical structure behind that estimate. Paired observations contain relationship information that affects variance, standard error, confidence intervals, t-statistics, and p-values. Independent samples do not preserve that pairing information.
So before choosing a formula or statistical test, ask one question first:
Are these observations genuinely paired or independent?
Answer that correctly, and most of the confusion surrounding mean differences disappears.
